

Multimodal context
Supply images as context columns in Adaptive Data so models can reason over visual reference material alongside the prompt.
Context columns aren’t limited to text. A context column can carry images—visual reference material the model reasons over alongside the prompt, the same way it would a document or a passage of retrieved text. If you are new to the concept, Column selection covers how context columns work in general; this guide focuses on the image case.
Use cases
Section titled “Use cases”Image context columns power a range of vision and multimodal tasks:
- Visual question answering — answer questions about the contents of an image.
- Image captioning — generate a natural-language description of an image.
- Visual reasoning — reason over relationships, counts, or spatial layout within an image.
- Image classification via prompting — assign labels to an image using a prompt instead of a trained classifier.
- Document question answering — extract or answer questions from scanned documents, forms, and other image-based text.
Use image context columns when your data is visual: building vision or multimodal datasets, OCR-style extraction from images, or generating image captions and descriptions as training data.
Supported image inputs
Section titled “Supported image inputs”How an image column is handled depends on where the dataset comes from. Each source currently supports the following image representations:
HuggingFace
Section titled “HuggingFace”bytes— raw image byteshf_struct— HuggingFaceImage()featurelist— array of image bytesurl— absolutehttp(s)URLspath— relative paths (e.g. animagefolder)
Kaggle
Section titled “Kaggle”- Image folders — no manifest (e.g.
train/<class>/*.png) - CSV / Parquet manifest with an image column
- Tabular file with a bytes or URL column
Direct file upload
Section titled “Direct file upload”For files uploaded directly (csv, parquet, json, jsonl, xlsx, and similar):
bytes/hf_struct/listurl— absolutehttp(s)URLs
Map image columns
Section titled “Map image columns”To see how image context works end to end, walk through the MathVision dataset—a collection of competition math problems where each question references a diagram or figure it can’t be solved without.
Each row holds the question text, multiple-choice options, the figure the question refers to, and the correct answer. Map them the same way in the app and in code:
question→ prompt column. The per-row question, e.g. “Which number should be written in place of the question mark?<image1>”.decoded_image→ image context column. The figure the question references, supplied to the model as an image.answer→ completion column. The expected answer.
In the app
Section titled “In the app”Image context is configured on the columns step of the Adaptive Data wizard:
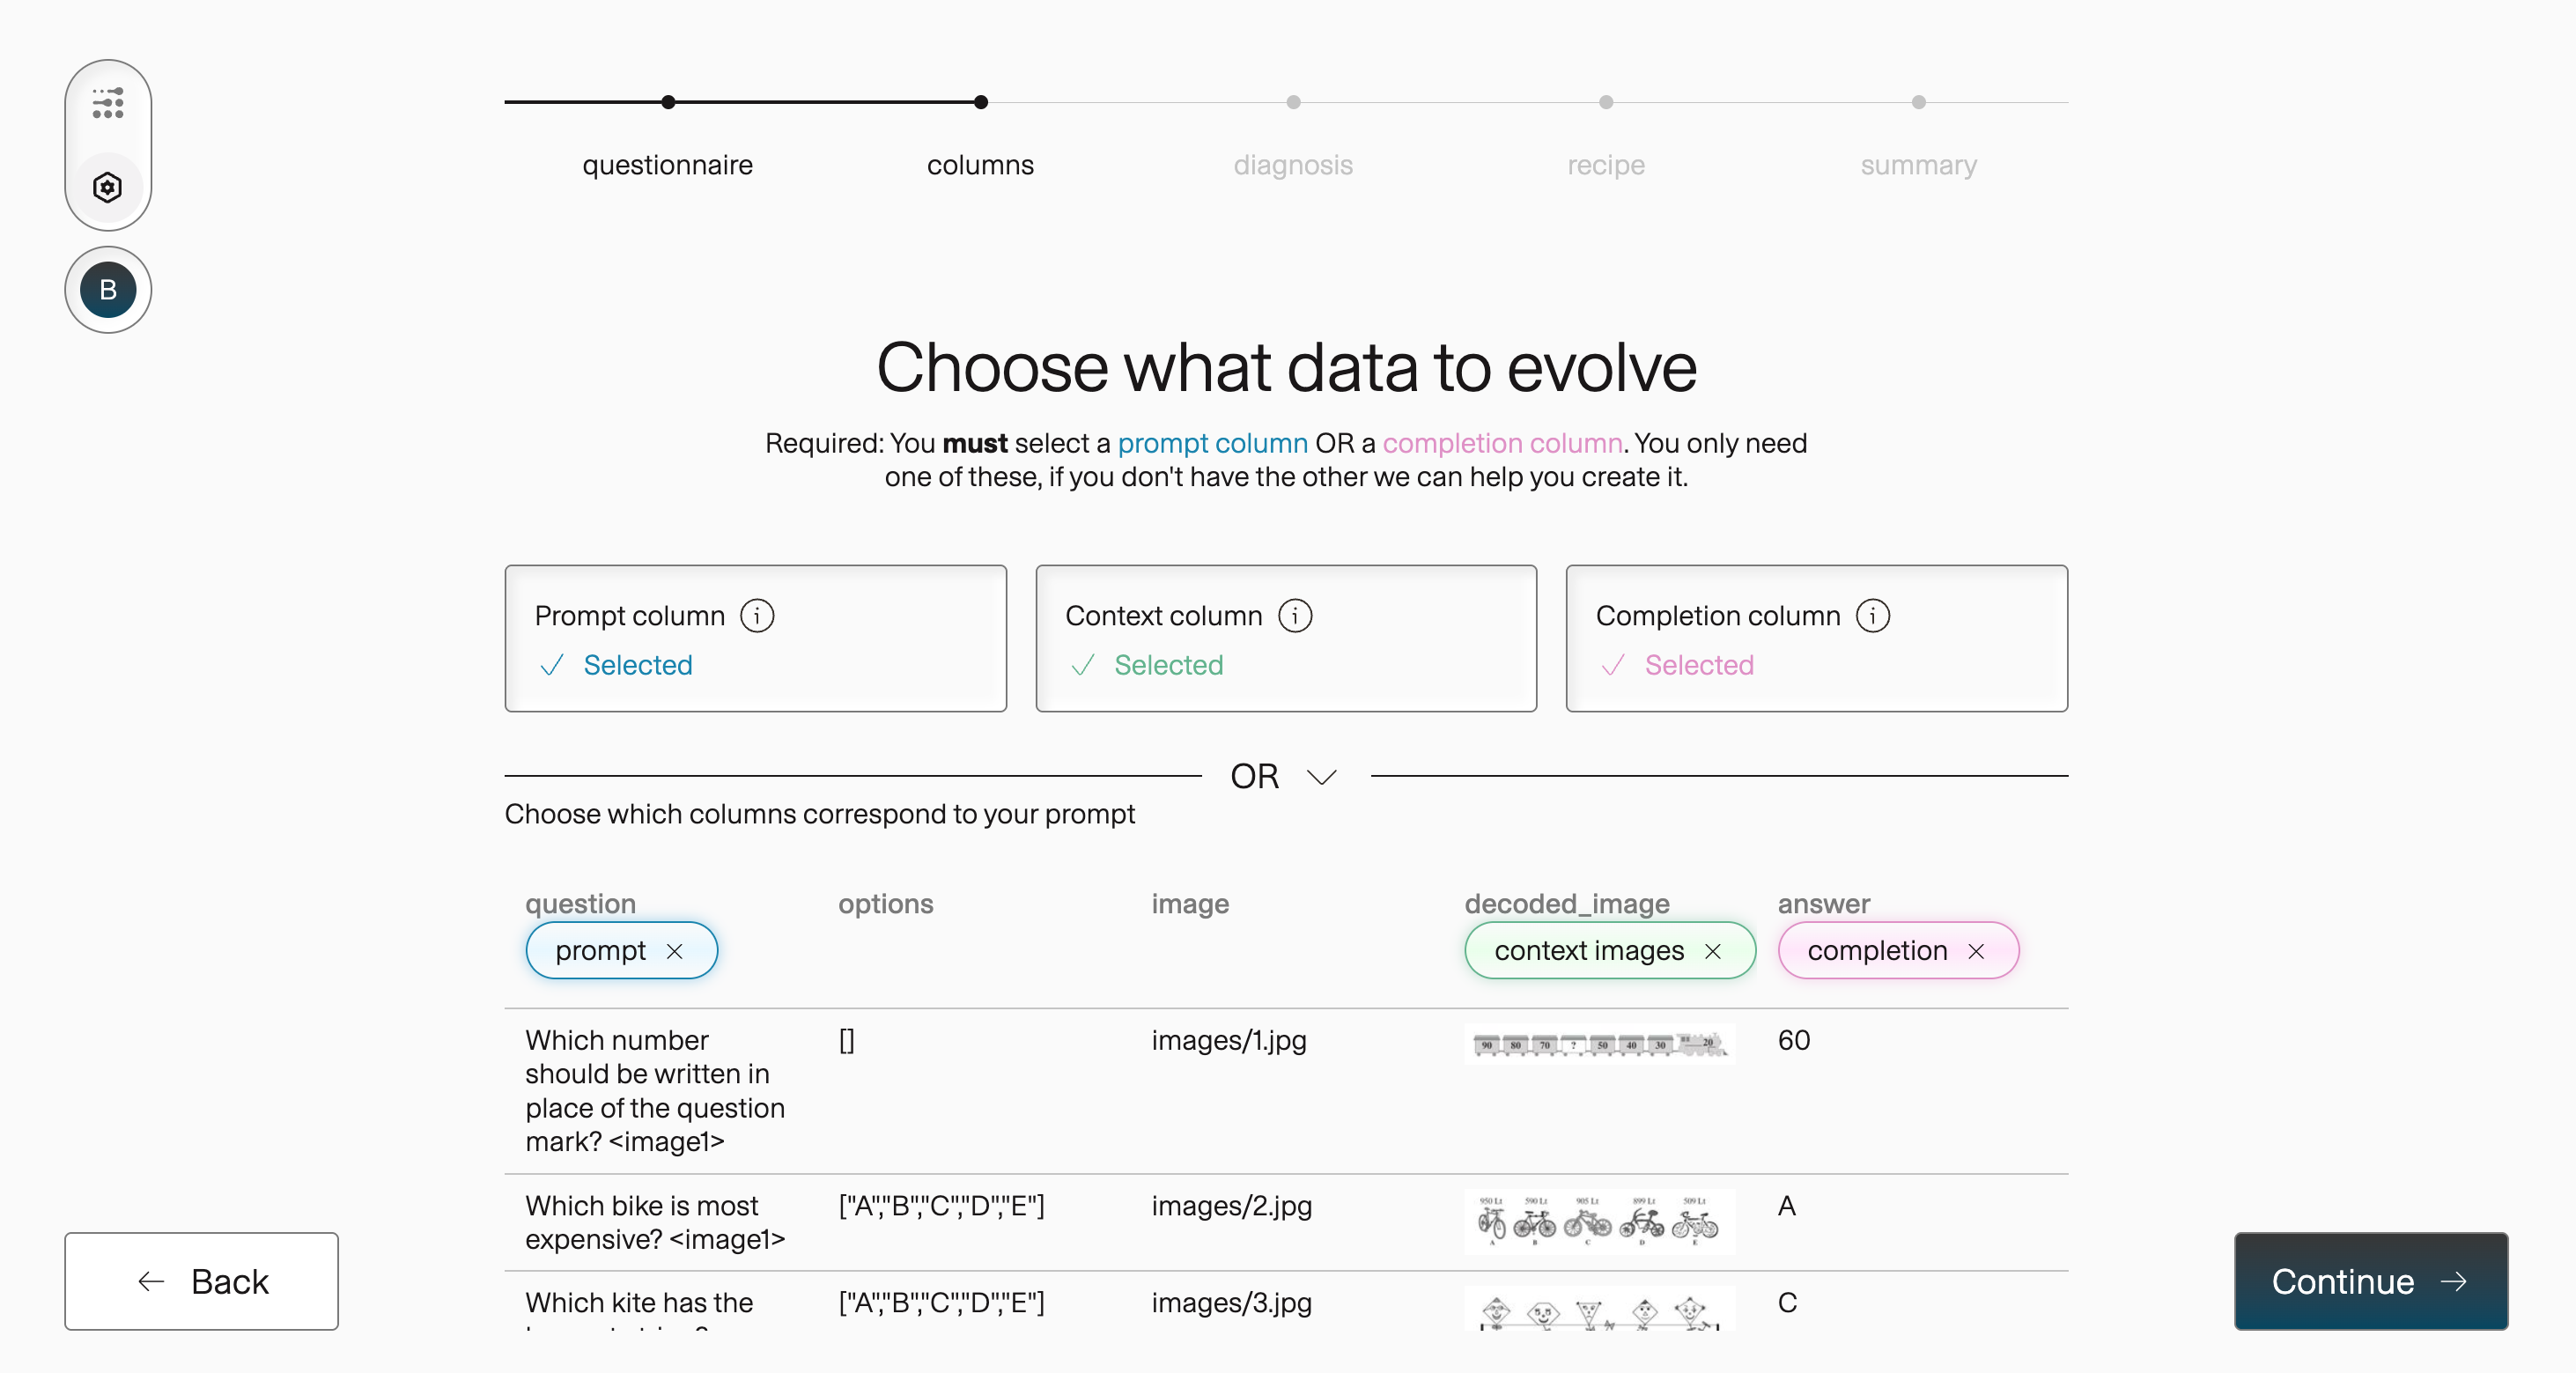
Because every row carries its own question, you map the question column as the prompt rather than writing one. If your rows instead shared a single instruction—say “Describe what’s shown in this image”—you’d use a universal prompt and supply only the image as context.
In the SDK and API
Section titled “In the SDK and API”The same MathVision mapping in the Python SDK uses the dedicated image field on column_mapping—not the context list:
run = client.datasets.run( dataset_id, column_mapping={ "prompt": "question", "completion": "answer", "image": "decoded_image", },)Use image for the image column. You do not need to duplicate it in context; the platform treats it as multimodal context automatically. See ColumnMapping in the API Reference for the full schema.
If every row shares the same instruction instead of a per-row prompt, pair image with universal_prompt:
column_mapping={ "universal_prompt": "Describe what's shown in this image.", "completion": "caption", "image": "decoded_image",}REST callers pass the same mapping to POST /api/v1/datasets/{dataset_id}/run:
curl -X POST "https://api.adaptionlabs.ai/api/v1/datasets/${DATASET_ID}/run" \ -H "Authorization: Bearer ${ADAPTION_API_KEY}" \ -H "Content-Type: application/json" \ -d '{ "column_mapping": { "prompt": "question", "completion": "answer", "image": "decoded_image" } }'Continue through the wizard
Section titled “Continue through the wizard”With your columns mapped, finish the remaining wizard steps—diagnosis, recipes, brand, and summary—then launch the run. The platform processes your dataset asynchronously; the dataset status updates when the job completes.
Review results in the View tab
Section titled “Review results in the View tab”When processing finishes, open the dataset and switch to the View tab. Each row lays out the adapted output side by side with your source data:
- Original completion — the short answer from your
answercolumn (e.g.11). - Enhanced prompt — the per-row question after adaptation, with any
<image1>reference intact. - Enhanced completion — the platform-generated response, typically a fuller step-by-step solution.
- Image column — the figure from your context mapping, rendered inline so you can verify visual reasoning against the diagram.
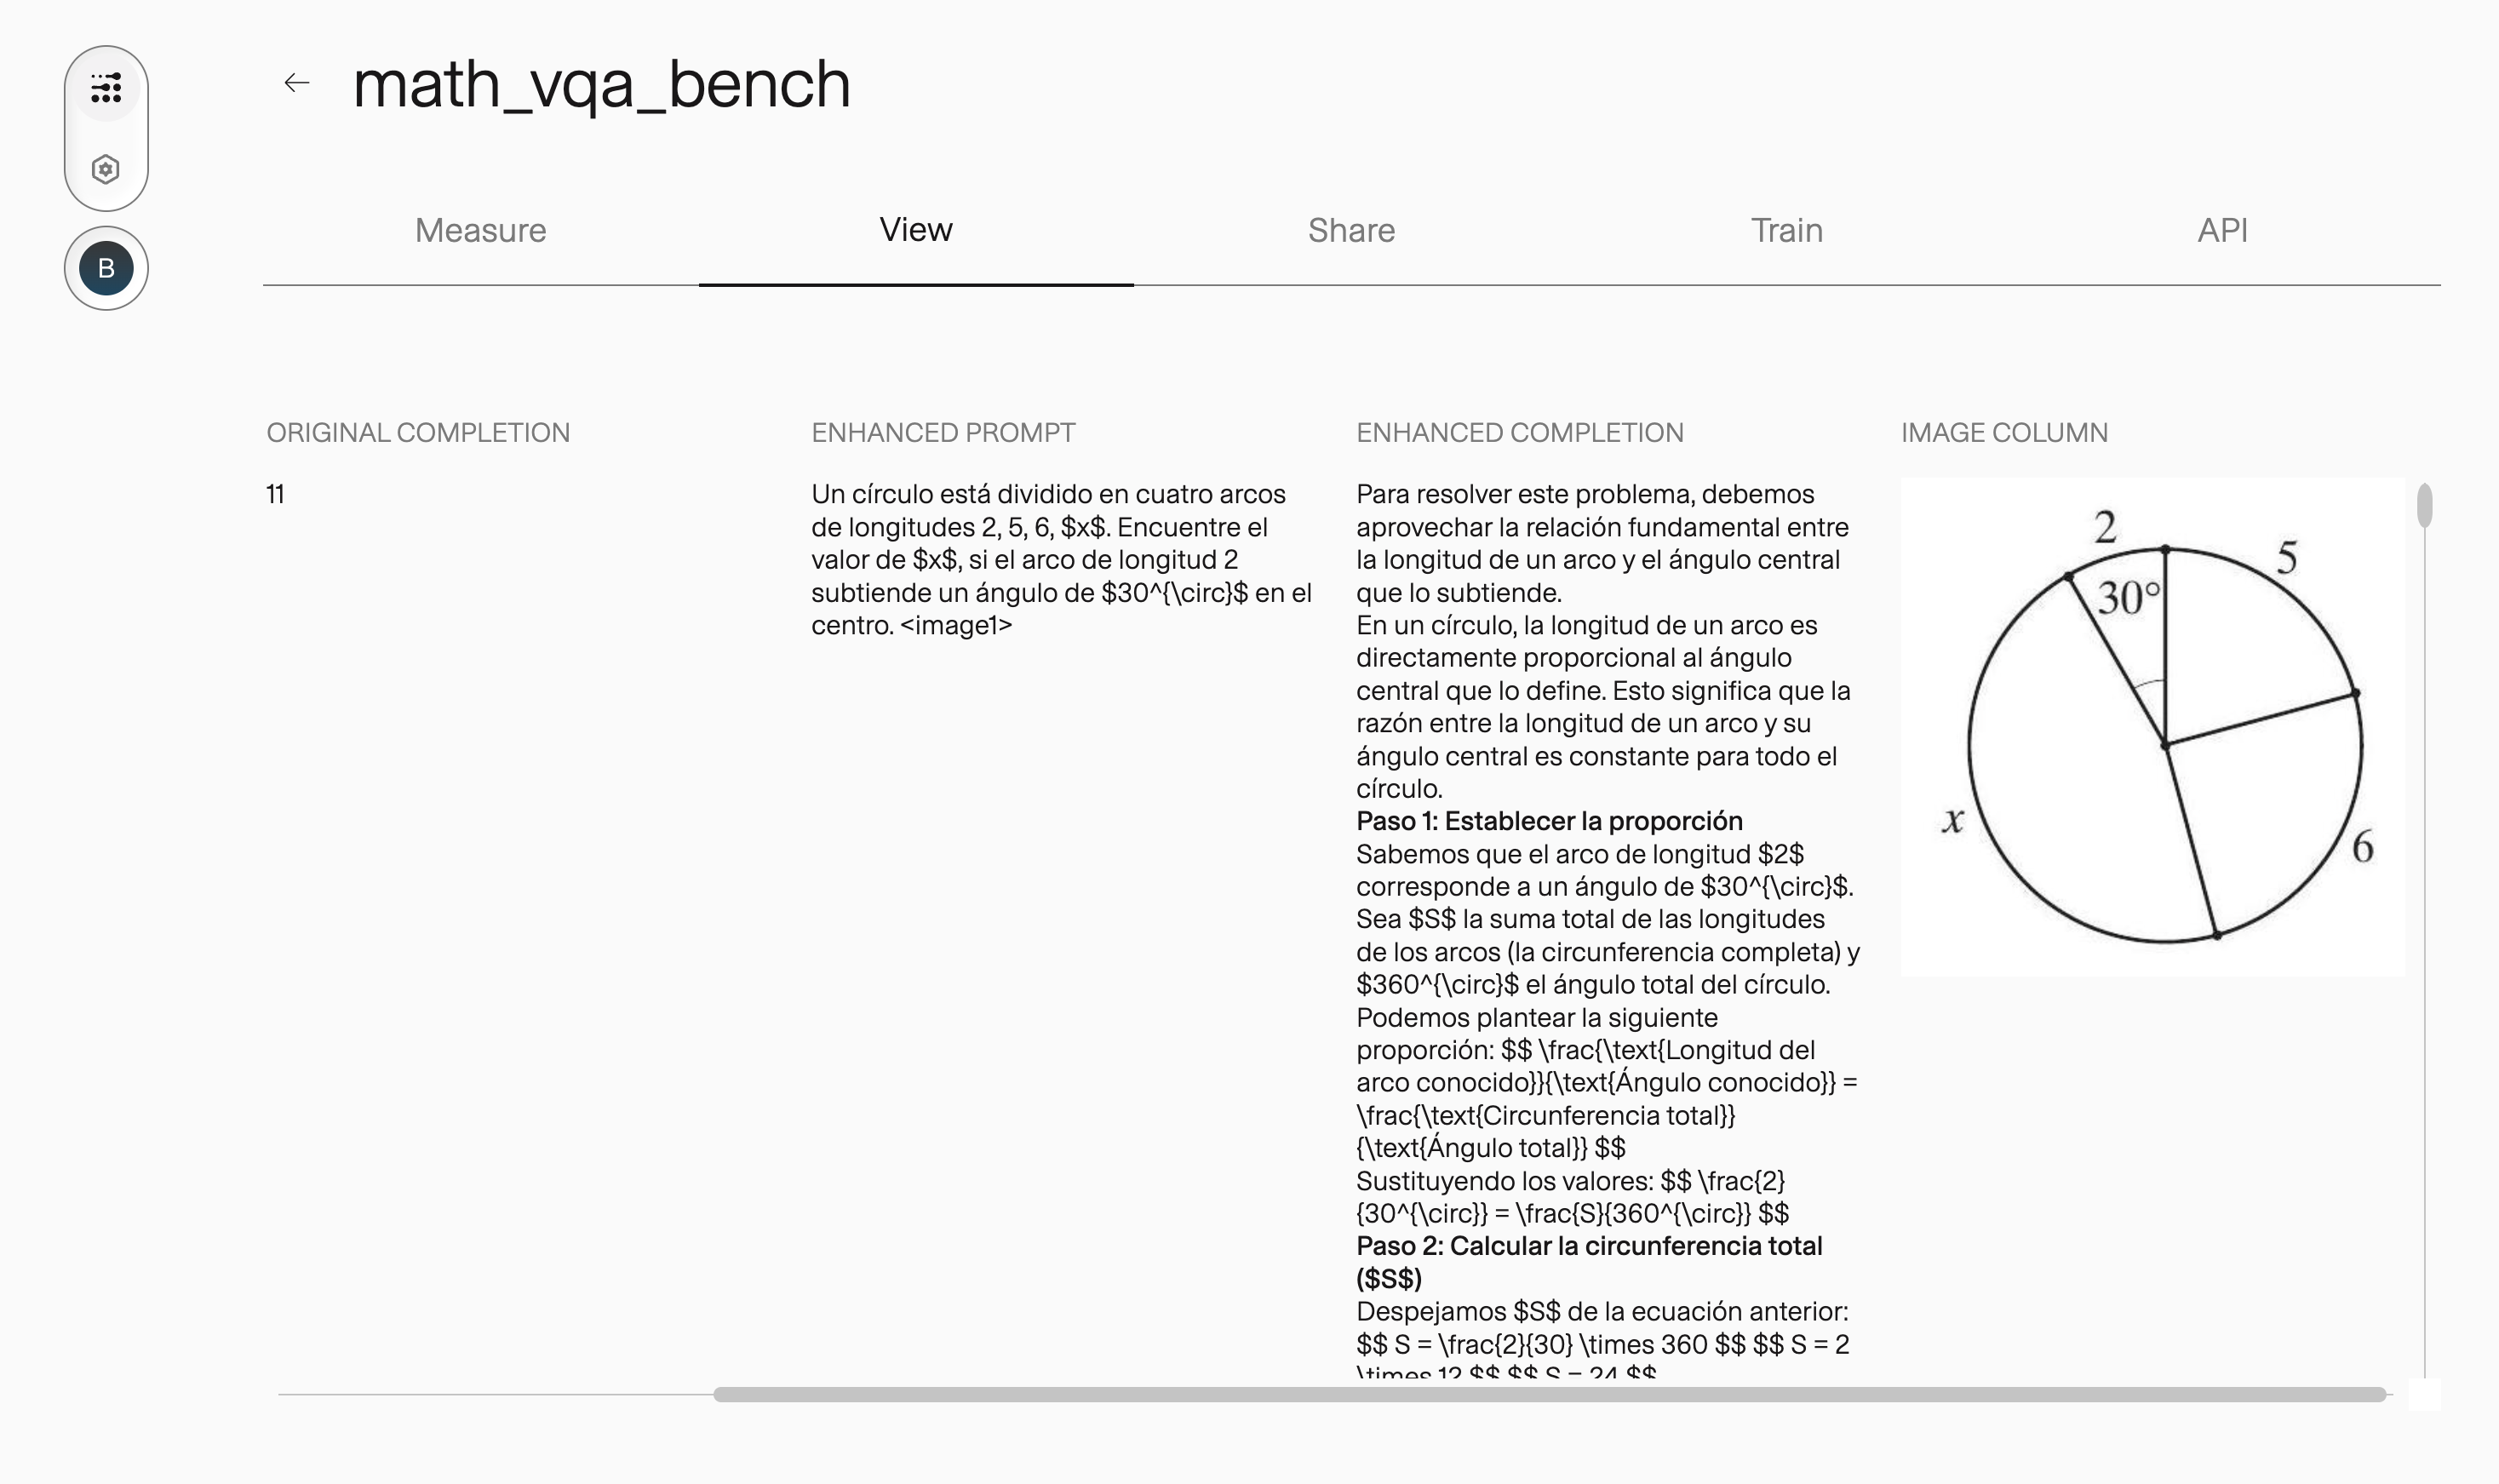
The screenshot above is from a run that used Expand to translate MathVision into Spanish.
Next steps
Section titled “Next steps”From here the workflow is the same as any other adapted dataset:
- Evaluating dataset quality — read quality scores and metrics after the run.
- Reasoning traces — add a chain-of-thought alongside each completion when the reasoning matters as much as the answer.